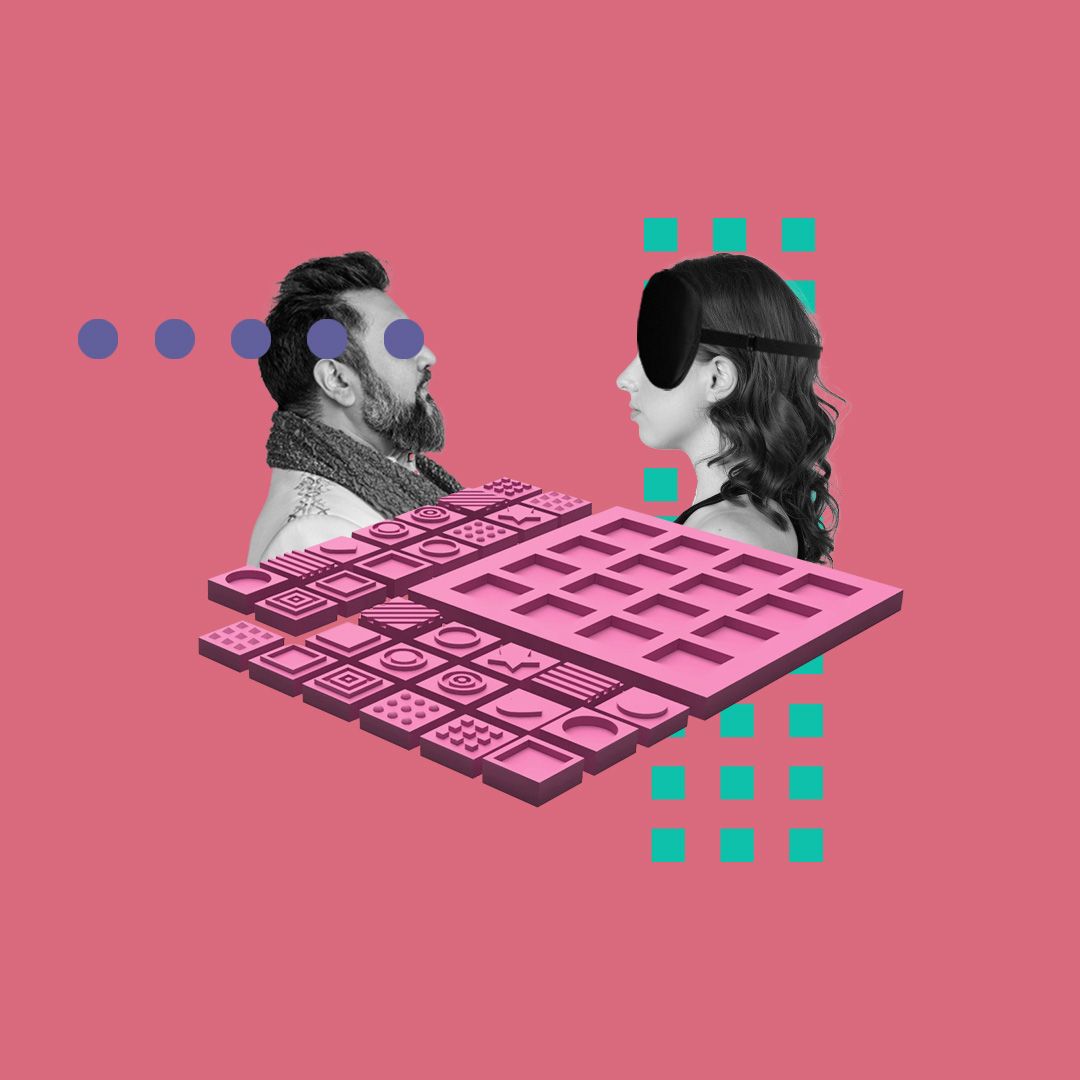
Make:able Challenge
Make:able is a free assistive technology design challenge, brought to you by PrintLab, Autodesk & partners. Join today for the chance to win 3D printers, 3D scanners and more.
Learn more
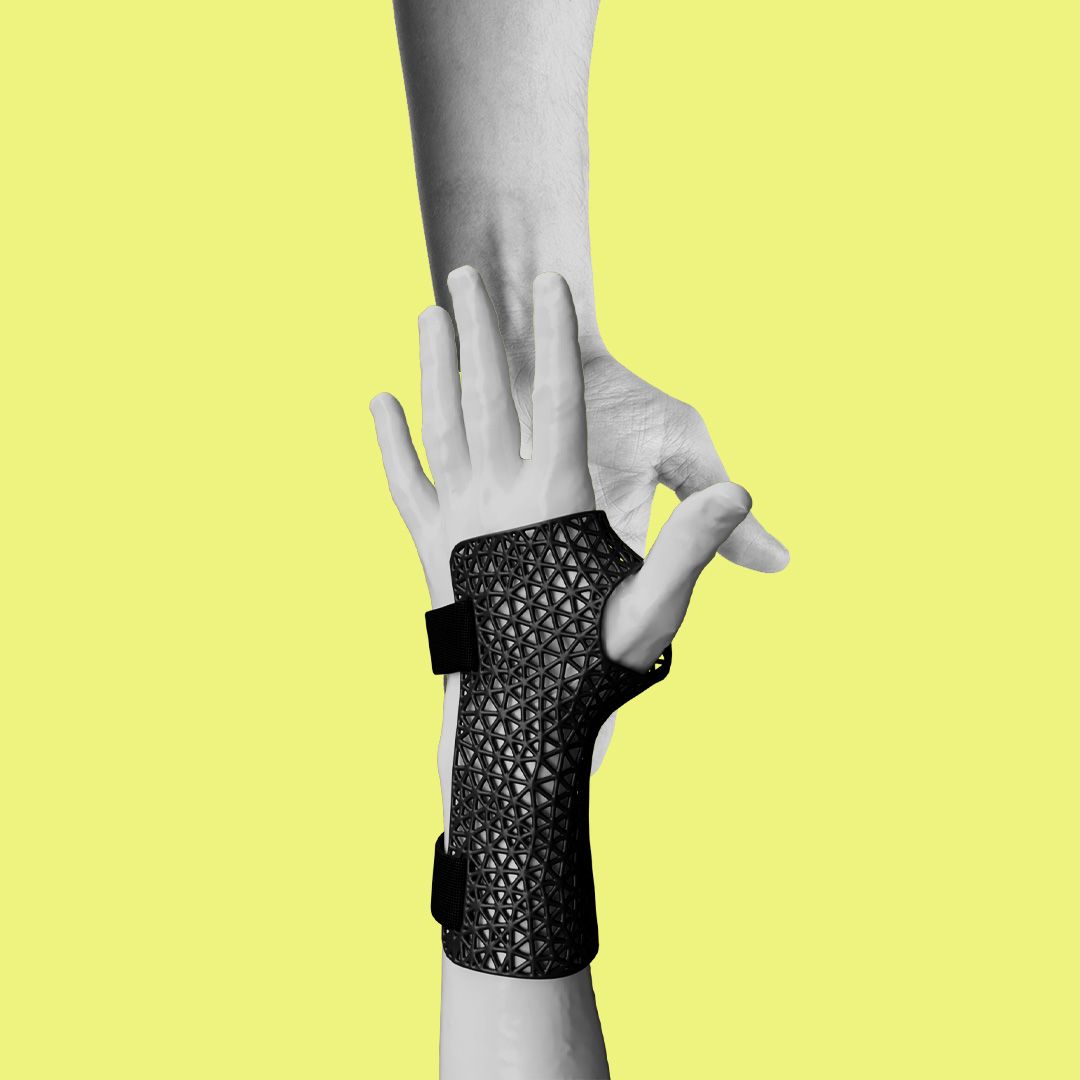
Use 3D printing as a tool to teach technical and soft skills in ways that can't be done with pen, paper or textbooks. All resources are standards-aligned and come with Tinkercad and Fusion 360 design tutorials, lesson plans, teacher instructions, rubrics and more.
Teach exciting hands-on workshops to your local community without having to worry about creating tutorials and resources yourself. Alternatively, share projects with your members online and allow them to work through them at home before using your 3D printers to bring their ideas to life.
Learn how to design with Tinkercad or Fusion 360 software, before going through the full creative process to 3D print your own homeware, architectural models, sculptures and more. Pick and choose from our comprehensive library and enjoy new projects each month.
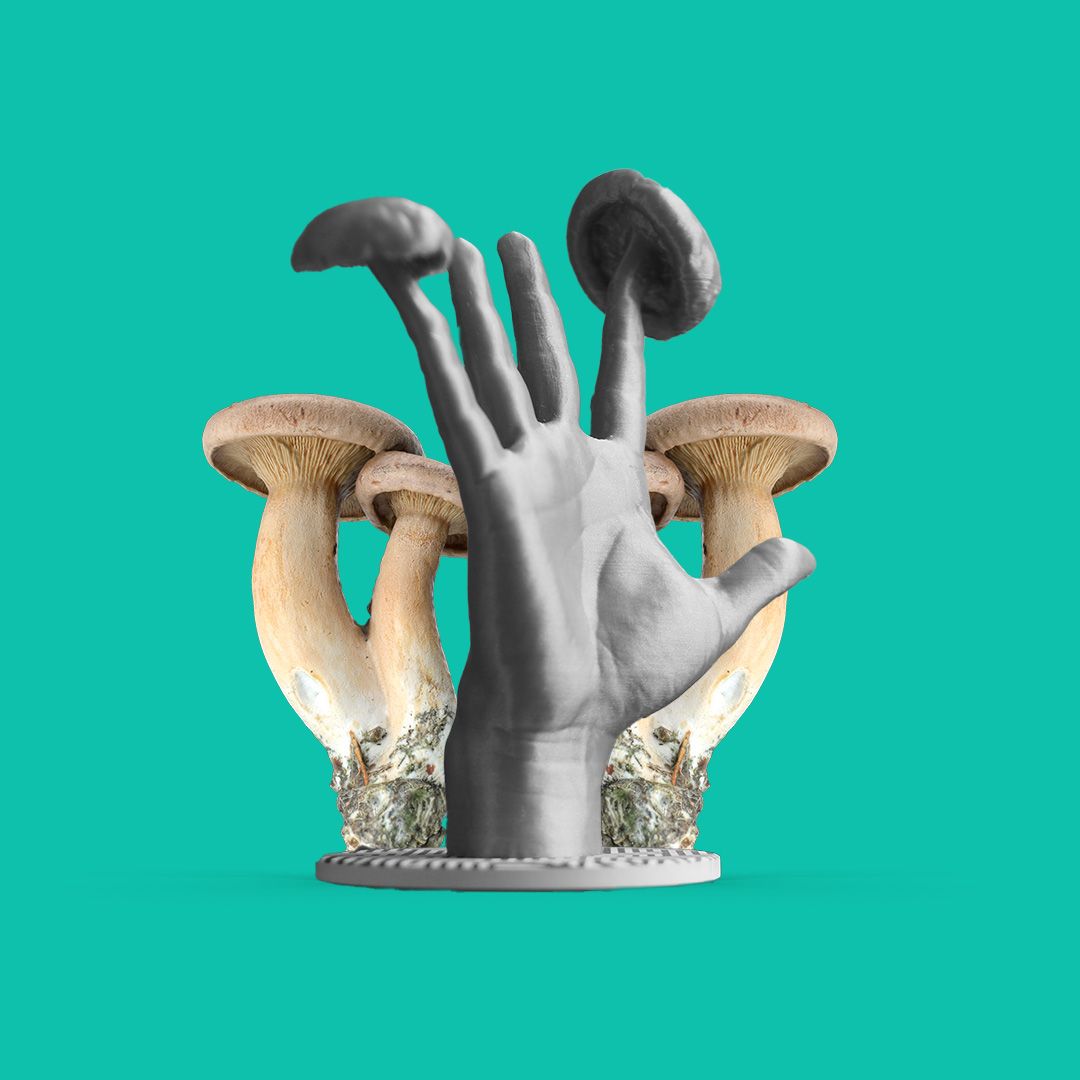
Make:able is a free assistive technology design challenge, brought to you by PrintLab, Autodesk & partners. Join today for the chance to win 3D printers, 3D scanners and more.
Learn more
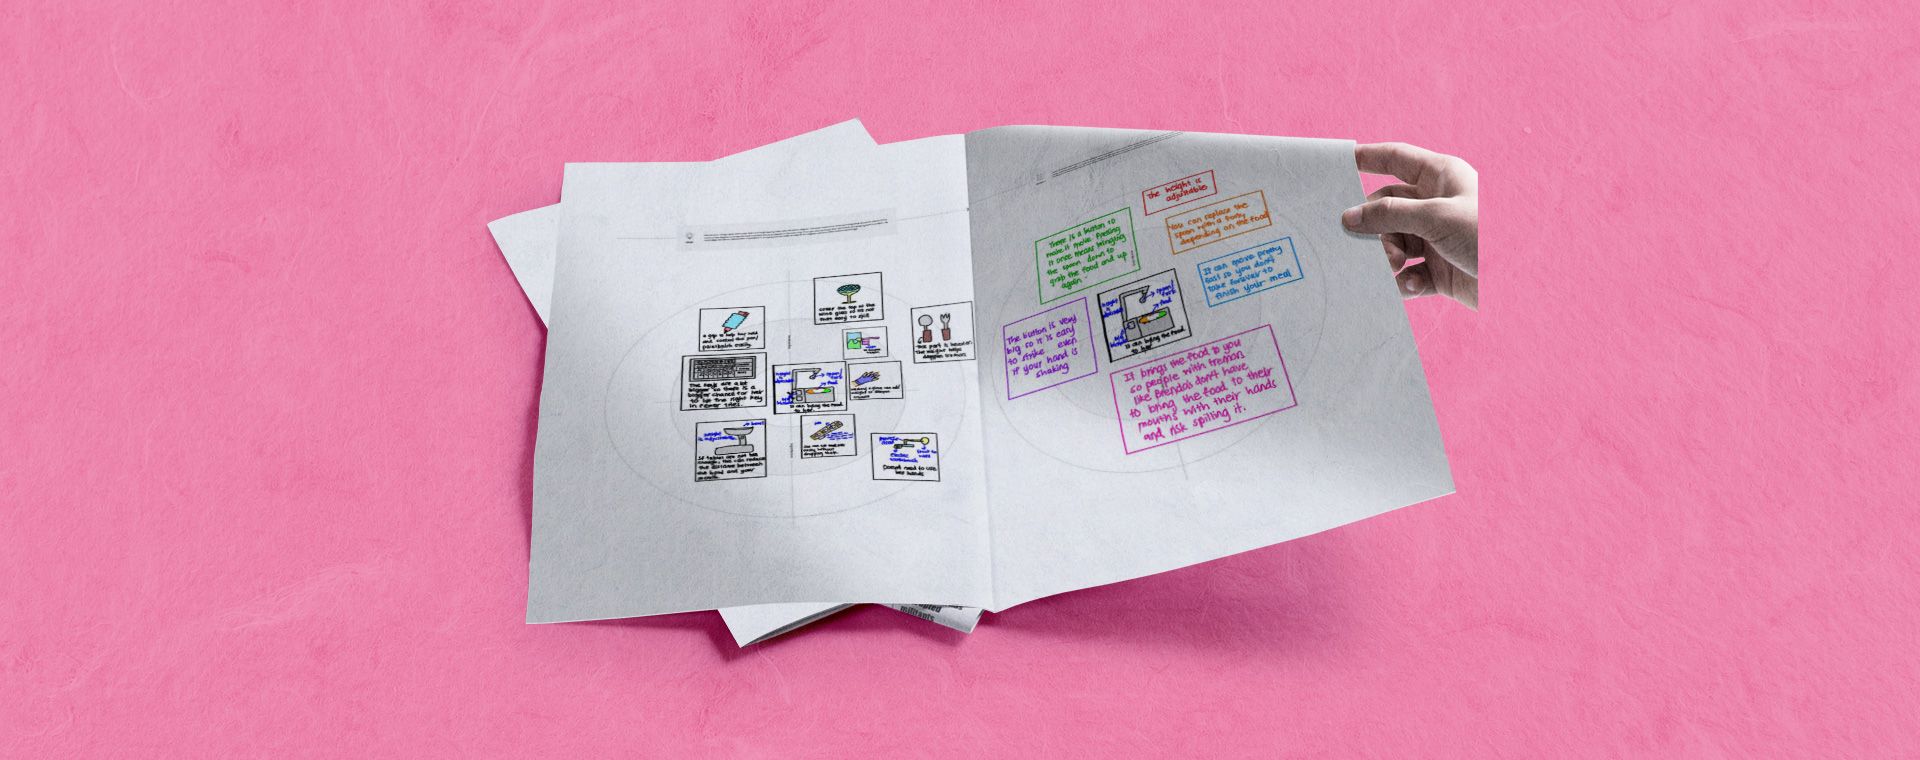
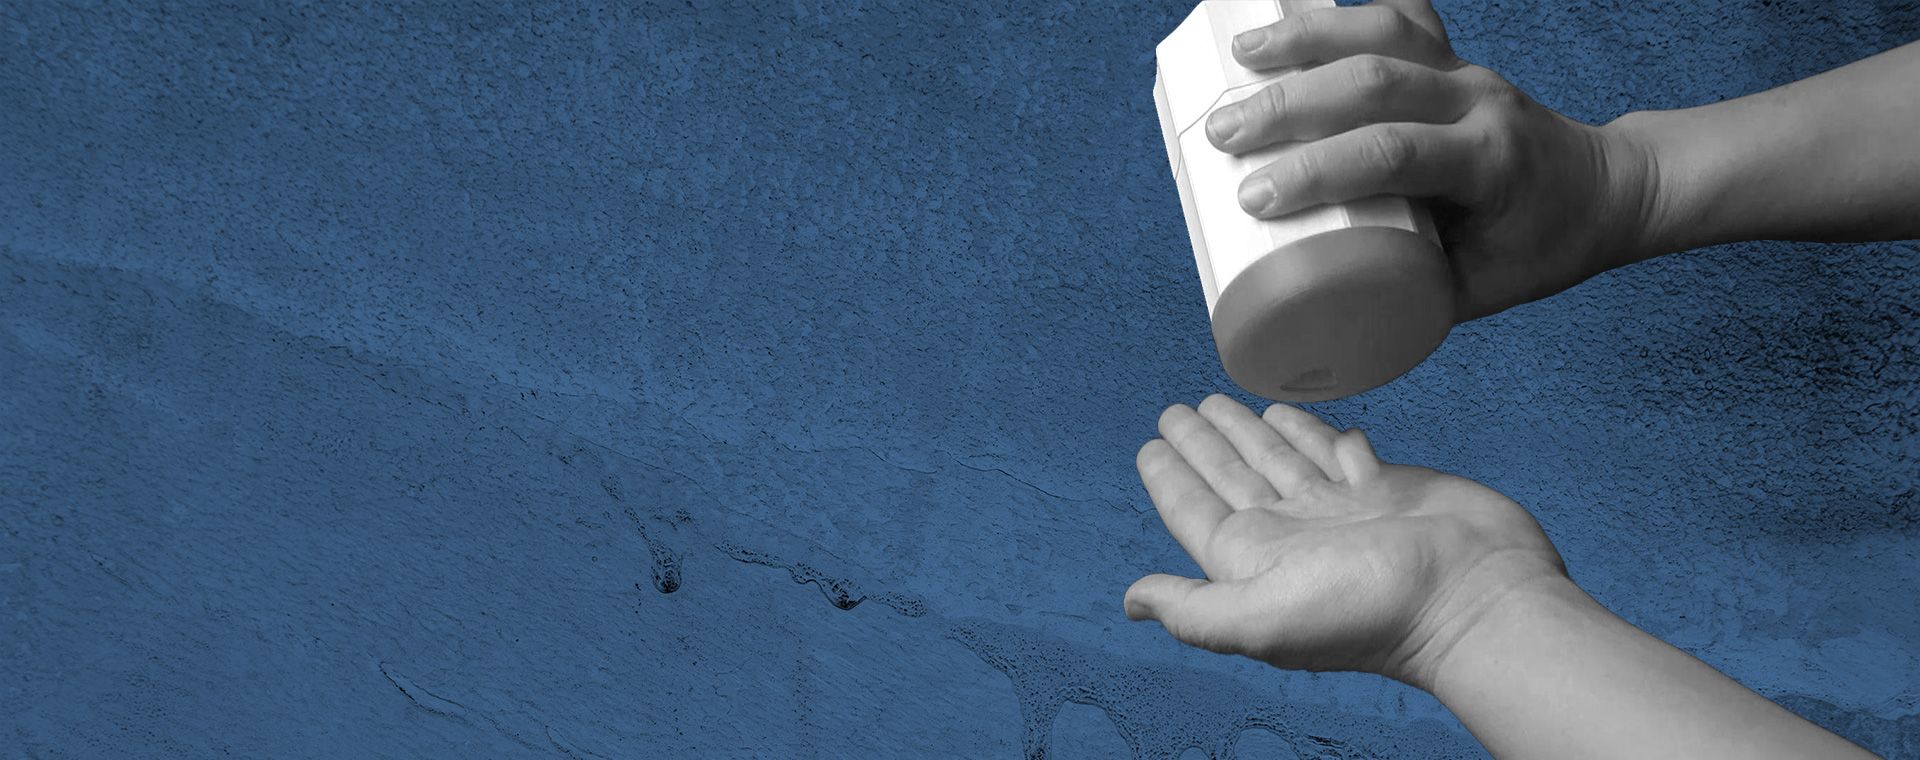
In this blog, we share 3 design thinking methods that can help you to develop empathy for end users, as well as generate and prioritise creative ideas.
Learn more
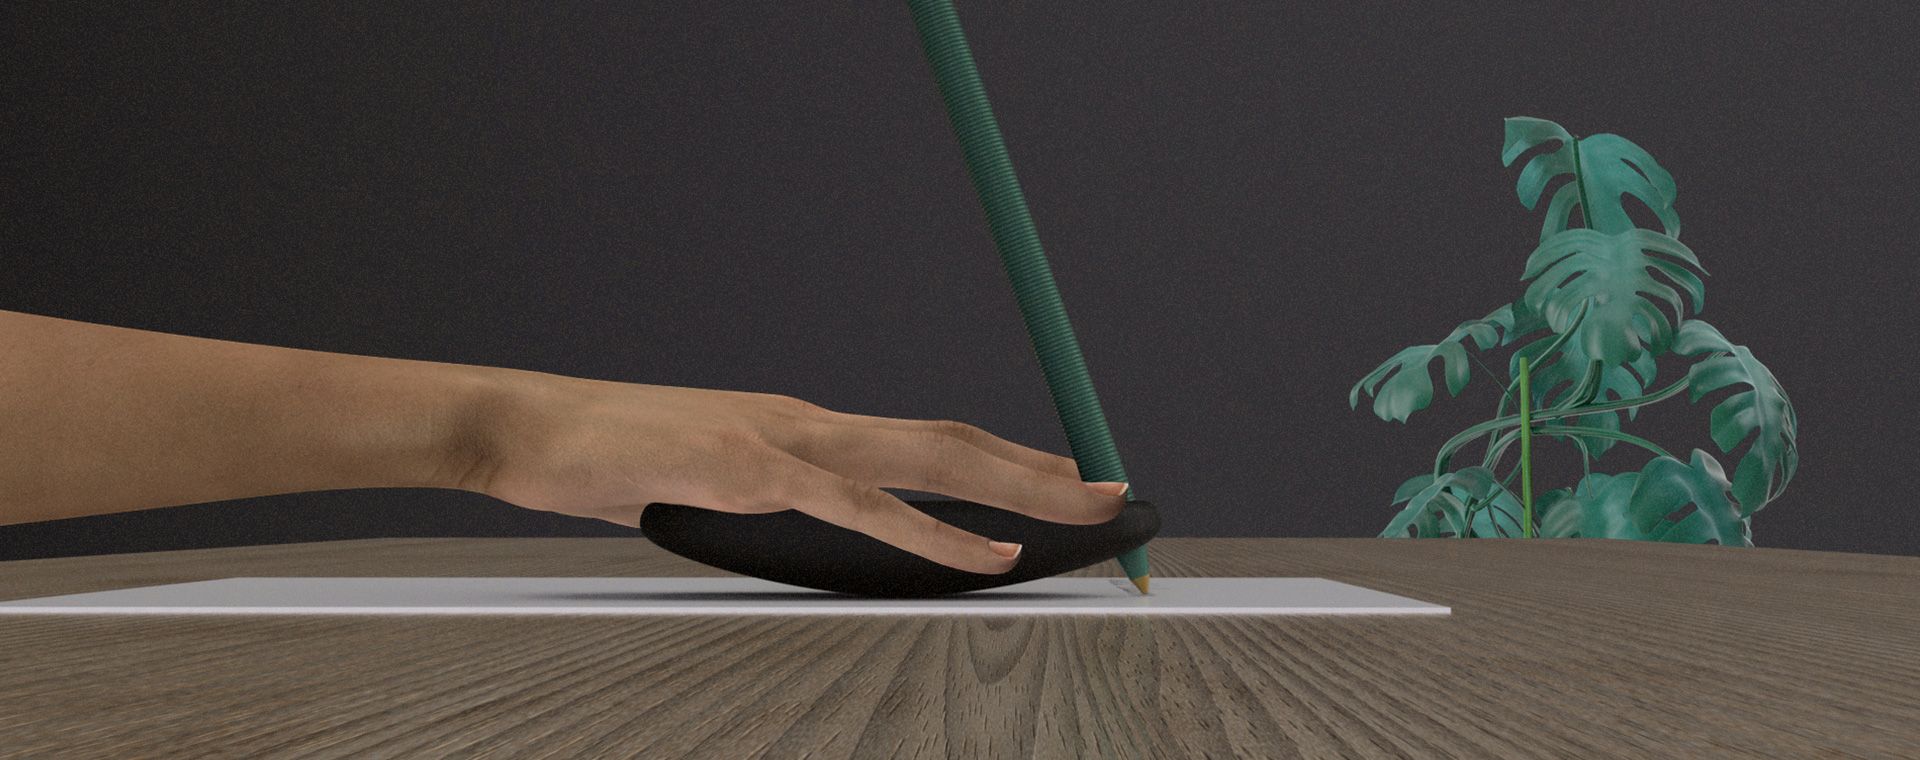
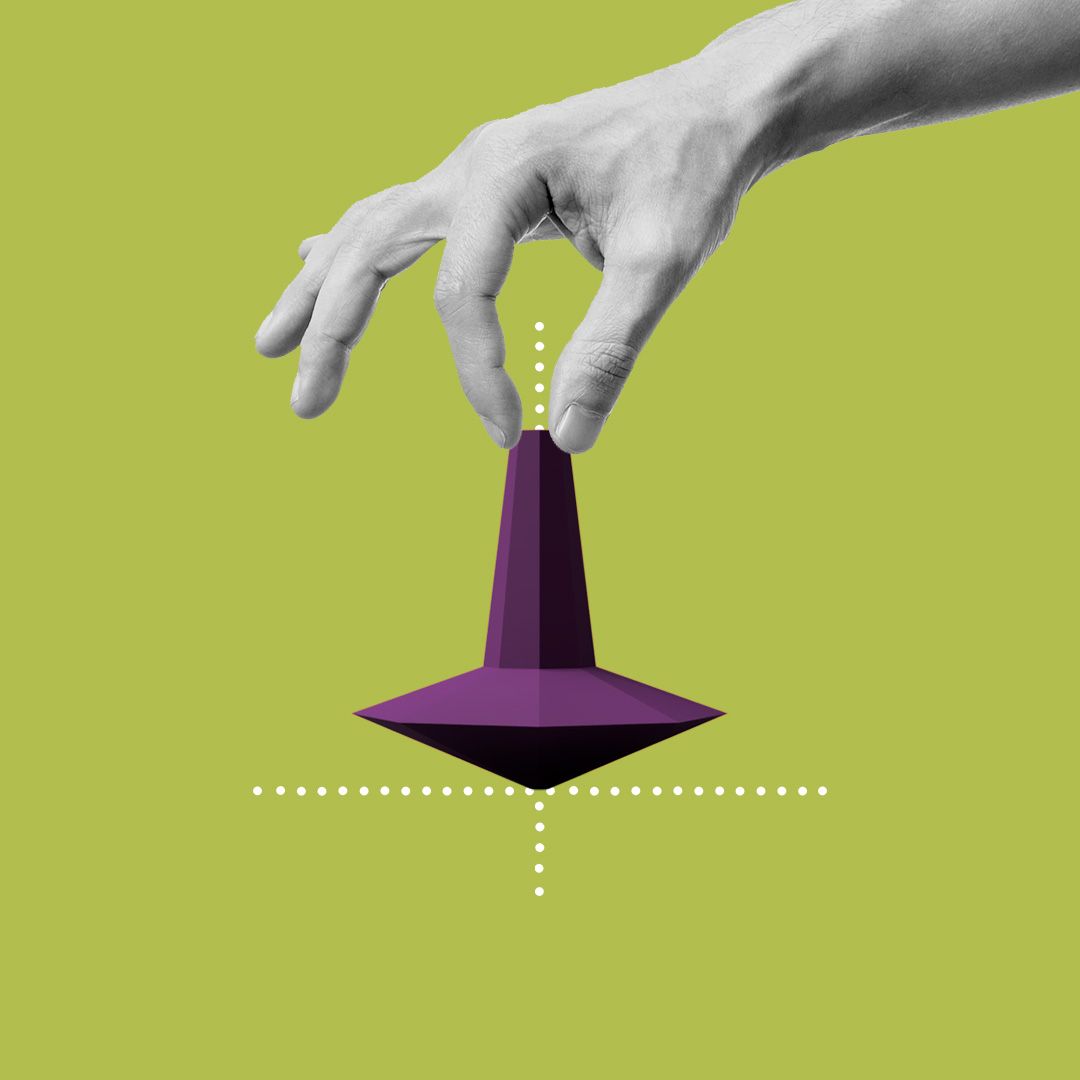
Quick tips for rendering your designs in Fusion 360. The topic of focus is creating context to give your designs a clear visual narrative.
Learn more
Join us in using 3D design and 3D printing to make unique products that bring value to the world